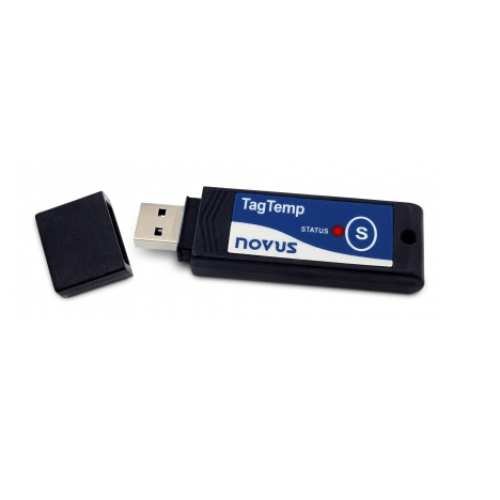
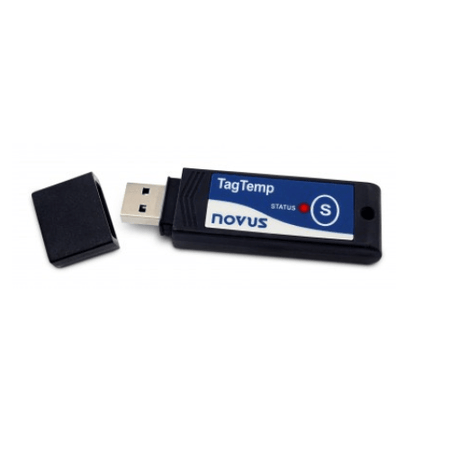
TagTemp-Stick is an electronic temperature data logger, compact and robust, that dispenses use of cables for configuration and data collecting. Plugs directly into a USB interface of a computer with Windows to communicate with the application LogChart II, which is the configuration and data analysis software for data loggers from TagTemp series.
The TagTemp-Stick has a high accuracy internal temperature sensor and is waterproof and can operate submerged up to 1m deep.
It is ideal for temperature recording in the transport and storage of refrigerated and frozen products, such as vaccines, blood products and food. As well
has wide application in the fields of biology, chemistry, pharmacy, logistics and industry.
Specifications
- Measure Range: 20.0 C to 70.0 C
- Accuracy: +- 0.5 C @ 25 C; +- 1 C max. along the entire measured range.
- Measurement Resolutions: 0.1 C
- Memory capacity: 32.000 (32 k) logs.
- Measurement Interval: 5 seconds min.; 18 hours max.
- Supply: 3.0 V lithium battery (CR2032), built-in
- Estimated autonomy (More than 400 days): Sampling rate of 1 minute.
- Estimated autonomy (More than 500 days): Sampling rate of 30 minutes.
- Operating temperature: From -20 C to 70 C
- Case: Polyamide
- Protection: up to IP67 degree of protection
- Dimensions: 78 x 23 x 12 mm
- Equipment to PC data transfer time: Proportional to the number of records. 20 seconds to 32,000 records
- PC Interface: Micro-USB
LogChart ll software operation environment:
- Configurator software for Windows 8, 7 and XP
- Menus in English, Portuguese or Spanish
- Sets up, reads and displays data on the screen.
Logchart Software:
The configuration of the TagTemp is done by the LogChart software for Windows. Data is transmitted to the TagTemp through the PC's USB port. The Parameter
Configuration window in LogChart lets you configure the following parameters:
- Logging session title
- Channel setup - name, type, limits, scaling
- Start log options - immediately or timed
- log rate
- logging options - stop when full, set number of readings or roll-over
After the logging session is complete, data can then be downloaded again by LogChart and displayed in table and chart formats. Data files can then be saved
as ASCII text files for importation into common spreadsheets. It is also possible to monitor data in real-time.